|
| General Specification |
| 입출력수 |
Fluke Norma 4000: 1 to 3
Fluke Norma 5000: 3, 4 or 6 |
| 무게 |
Fluke Norma 4000: Approx. 5 kg (11 lb.)
Fluke Norma 5000: Approx. 7 kg (15 lb.) |
| 크기 |
Fluke Norma 4000: 150 mm x 237 mm x 315 mm
(5.9 in x 9.3 in x 12.4 in)
Fluke Norma 5000: 150 mm x 447 mm x 315 mm
(5.9 in x 17.6 in x 12.4 in) |
| 내장 프린터 |
Fluke Norma 4000: No
Fluke Norma 5000: Yes (optional) |
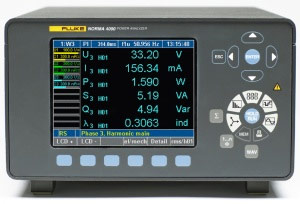
| 디스플레이 |
Color, 5.7“ / 144 mm - 320 x 240 pixel
User-selectable background lighting and contrast. |
| 주파수대역 |
dc to 3MHz or dc to 10MHz depending on input module |
| 기본정확도 |
0.2%, 0.1% or 0.03% depending on input modules |
| 샘플링 |
0.33 MHz or 1 MHz depending on input modules |
| 입력전압 |
0.3 V to 1000 V |
| 입력전류(direct, not via shunt) |
0.03 mA to 20 A depending on input module |
| 메모리(for Configurations) |
4 MB |
| 메모리(for Settings) |
0.5 MB |
| Fast Fourier Transformation (FFT) |
40차 |
| RS232/USB 인터페이스 |
Standard |
PI1 Process interface
(8 analog/impulse inputs and 4 analog outputs) |
Optional |
IEEE 488.2/GPIB interface
(1 MBit/s Ethernet / 10 MBit/s or 100 MBit/s) |
Optional |
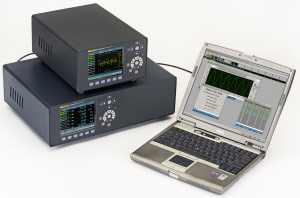
Fluke NormaView PC 소프트웨어
(for data download, analysis & report writing) |
Standard |
| Basic Functions |
| Fast Fourier Transformation (FFT) |
그래픽 고조파계산
동시에 3개의 Bar-graph 디스플레이.
측정값: U, I, P per phase
Order: 1st to 40th harmonics, maximum half sample frequency |
| Digital Oscilloscope (DSO) |
Simultaneous display of up to 3 measured values on sample level. Quick view of curve form and distortion. |
| Integration function (energy) |
Simultaneous display of up to 6 configurable numeric values. Start/Stop conditions and positive negative direction available. |
| 벡터 디스플레이 |
Vector display of HO1 up to 6 signals. For easy testing of the right connection of the instrument and quick overview of the phase angle of each signal. |
| 레코더 |
Display of average values over time for trend determination. |
| RAM data memory |
Storing of sample and average values; setting of start and stop conditions.
From the RAM approximately 4 MB are available for the storage of measured values. |
| Configuration |
Set up the analyzer to measure and display data in the format required. |
| Ambient Conditions |
Working Temperature Range |
5 °C to 35 °C (41 °F to 95 °F) |
| Storage Temperature Range |
-20 °C to 50 °C (-4 °F to 122 °F) |
| 하우징 |
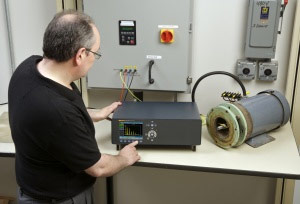
Fluke Norma Power Analyzers are extremely compact and equipped with a solid metal case to meet stringent EMC requirements. |
| 기후조건 |
KYG DIN 40040, max. 85 % relative humidity, non-condensing. |
| 전원 |
85 V ac to 264 V ac, 50 Hz to 60 Hz, dc 100 to 260 V, ca. 40 VA European plug with switch. Binding post for current available on some models. |
| Measuring Inputs |
Safety sockets 4 mm, 2 for each input. External shunt connection over BNC socket. |
| 동작 |
Membrane keyboard with cursor – function keys and direct functions. |
| Connections |
Rear panel of the 3-phase Analyzer |
| Measured Values |
|
Non-gapping calculation of averaged values for each phase. In three phase system additionally calculation of total power and averaging of V and I of the three phases. The fundamental H01 will be calculated in synchronous mode also for these values. |
|
Urms effective value, Urm rectified mean, Um mean value |
|
Up-, Up+, Upp peak values |
|
Ucf crest factor Ucf, Uff form factor |
|
Ufc fundamental content |
|
Uthd distortion factor DIN, IEC |
|
Irms effective value, Irm rectified mean, Im mean value |
|
Ip-, Ip+, Ipp peak values |
|
Icf crest factor Icf, Iff form factor |
|
Ifc fundamental content |
|
Ithd distortion factor DIN, IEC |
|
P active power [W] |
|
Q reactive power [Var] |
|
S apparent power [VA] |
|
ë, cos. phase angular |
|
Integral function for active power P, reactive power Q, apparent power S, voltage (Um) and current (Im), |
|
Number of digits 4 or 5 dependent on measured value. |
|
| Frequency and Syncronization |
| 범위 |
DC and 0.2 Hz to sample rate |
| 정확도 |
±0.01 % of measured value (reading) |
| |
• |
Channels which can be selected: all U/I or external input. |
• |
One of three low pass filter with different frequencies can be switched into the signal. |
• |
The frequency is always visible on the top of the screen. |
• |
The BNC synchronization socket on backside of the instrument can be used either as input or output. |
• |
The input signals can be measured up to the sample rate of the power phase. The maximum level must not be higher then 50V. |
• |
The output signal is a pulsed 5Volts TTL signal (frequency depends on the measured synch frequency). |
|
| Configuration Memory |
| |
Up to 15 user configurations can be saved into a permanent memory and reloaded later on. Changes that were not saved are lost after switching off the instrument. |
| Interface |
| |
펌웨어 및 PC로의 데이터통신을 위한 RS232.
프린터는 외부컨버터로 연결될 수 있습니다. |
| 옵션 |
IEEE 488.2 / 1 MBit/s
Ethernet / 10 MBit/s or 100 Mbit/s |
| Standards and Safety |
| 안전등급 |
EN 61010-1 / 2nd Edition 1000 V CAT II (600V CAT III)
Degree of pollution 2, safety Class I
EN 61558 for transformer
EN 61010-2-031/032 for accessories |
| 최대 입력값 |
For voltage inputs Measurement range 1000 Veff, 2 kVpeak
For current inputs Measurement range 10 Aeff, 20 Apeak |
| 테스트전압 |
Net input : case (protective conductor): 1.5 KV AC
Net connection : Measurement input: 5.4 kV AC
Measurement inputs : Case: 3.3 kV AC
Measurement input : input: 5.4 kV |
| 전자기 호환성 |
Emission: IEC 61326-1, EN 50081-1, EN 55011 Class B
Immunity: IEC 61326-1 / Annex A (industrial sector), EN 50082-1 |


))